July 13, 2022

Bear markets make even the savviest investors nervous because they are accompanied by heightened uncertainty about the future. Yet a quick review of history reminds us that drawdowns are a normal part of investing. Since the late 1920s, the S&P 500 index has experienced approximately 25 bear markets of varying degrees1. Each one was different but had similar effects. They resulted from increased selling driven by rising fear. Each bear market recovered when what was feared the most inevitably subsided.
How does today compare to history?
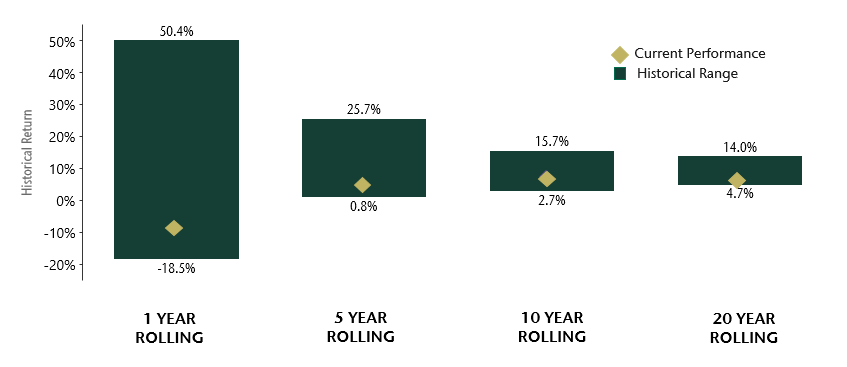
When we look at history, we find that the returns our clients are experiencing now are within the range of expected outcomes. For example, the current one-year performance for our Balanced benchmark is -8.6%2 (from June 30, 2021). Since 1980, the benchmark’s 1-year rolling returns spanned -18.5% to 50.4%. Longer-term performance, including 5, 10, and 20-year periods, are also well within the range of historical experience.
Balanced benchmark historical returns
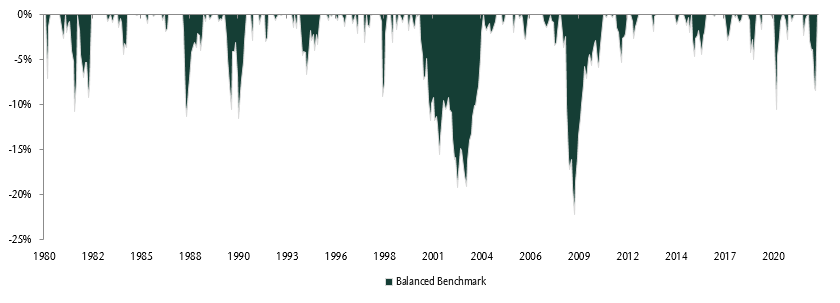
The next chart provides additional context on where we are today. It illustrates the Balanced benchmark’s historical declines from new highs. As you can see, recent declines are still within the range of historical drawdowns.
Peak-to-trough declines (1980- 2022)
“Shouldn’t I be doing something?”
It is understandable for investors to seek ‘safer’ havens, such as selling equities in favour of cash or bonds. However, while such impulse decisions may provide immediate relief, they can also jeopardize future wealth.
To understand this further, let’s examine a fictitious client who invested $1.0 million five years ago in a balanced portfolio (55% equities/45% fixed income). Given actual performance, the investor’s portfolio would be worth $1.34 million today. In 10 years from now, we would expect the median portfolio value to reach $2.0 million3. In other words, a 49% increase in wealth over the next ten years.
For illustrative purposes, suppose the client completely sells out in early July 2022 in pursuit of a less volatile strategy. Approximately $91,000 would be owed in tax upon liquidation4. This means net proceeds of $1.249 million would be available for re-investment. If the client then buys only short term bonds, we would expect the 10-year portfolio value to be $1.4 million— a staggering $600,000 (or 30%) less than our forecast for maintaining the original balanced asset mix.
Some investors who sell out may intend to return to their long-term strategy within the ten-year forecasting period. This may be true, however, they will almost certainly miss out on significant upside when the market rebounds. Furthermore, rebounds typically occur well before the outlook or economy seems to improve. Sticking to a well-considered, strategic asset mix is expected and has proven to pay off over time.
Revisiting the plan – most clients have a margin of safety
Most financial advice is based on ‘today.’ However, today is not that important in the context of a lifetime. What is important are the decisions investors make during the small number of days—less than one percent of the time—when everyone else is selling based on fear.
Our investment planning framework uses a wide range of returns reflecting the good and bad times. Doing so builds a margin of safety since we cannot know what the future holds. When we look across our clients’ plans, most have excess capital or room for error in their future. This means that if these clients were to achieve worse outcomes than our forecasts, or those experienced historically, they could still have confidence in meeting their future lifestyle spending needs.